Sprint Surges and Cupset Cash: Data Patterns Fuel Value Bets in Short Races and Soccer Knockouts
Sprint Surges and Cupset Cash: Data Patterns Fuel Value Bets in Short Races and Soccer Knockouts
Short Races Where Pace Crumbles and Closers Cash In
Observers of sprint horse races—those blistering 5- to 6-furlong dashes—often spot a recurring pattern; front-runners bolt out fast, set brutal early fractions, then fade dramatically as closers surge late to snatch victory from the jaws of exhaustion. Data from major tracks worldwide backs this up, showing how pace collapse in sprints creates prime value betting spots, especially when odds overlook the math. Take U.S. tracks tracked by Equibase, where analysis of over 10,000 six-furlong races reveals front-runners winning just 22% of the time when leading by more than 2 lengths at the quarter-pole, dropping to 14% if the pace exceeds 21.5 seconds for the initial furlong.
But here's the thing: those surges don't happen randomly; track biases play a huge role, with speed-favoring surfaces early in the card giving way to closer-friendly slop later, particularly after rain softens the ground. Experts who crunch historical charts note that in such conditions, horses with "second-move" speed—those sitting third or fourth early—hit at 28% clips, far outpacing their implied odds of 15-1 or higher. And in April 2026, as U.S. Triple Crown preps heat up alongside European sprint trials, punters already eye Gulfstream and Santa Anita meetings where data logs show 35% of sprints decided by late-running types when the leader's opening quarter clocks in under 22 seconds.
What's interesting is how trainers exploit this; data indicates specialists like Wesley Ward target sprints with confirmed pace-melters up front, positioning their charges for the surge, resulting in a 32% win rate for his juveniles in 5-furlong romps over the past three seasons. People who've backtested these patterns find value stacking when combining surge profiles with workout bullets—sharp 4-furlong breezes under 48 seconds signal readiness for the stretch run, boosting strike rates by 12 percentage points.
Soccer Knockouts: Where Underdogs Flip Scripts in Single-Elimination Fury
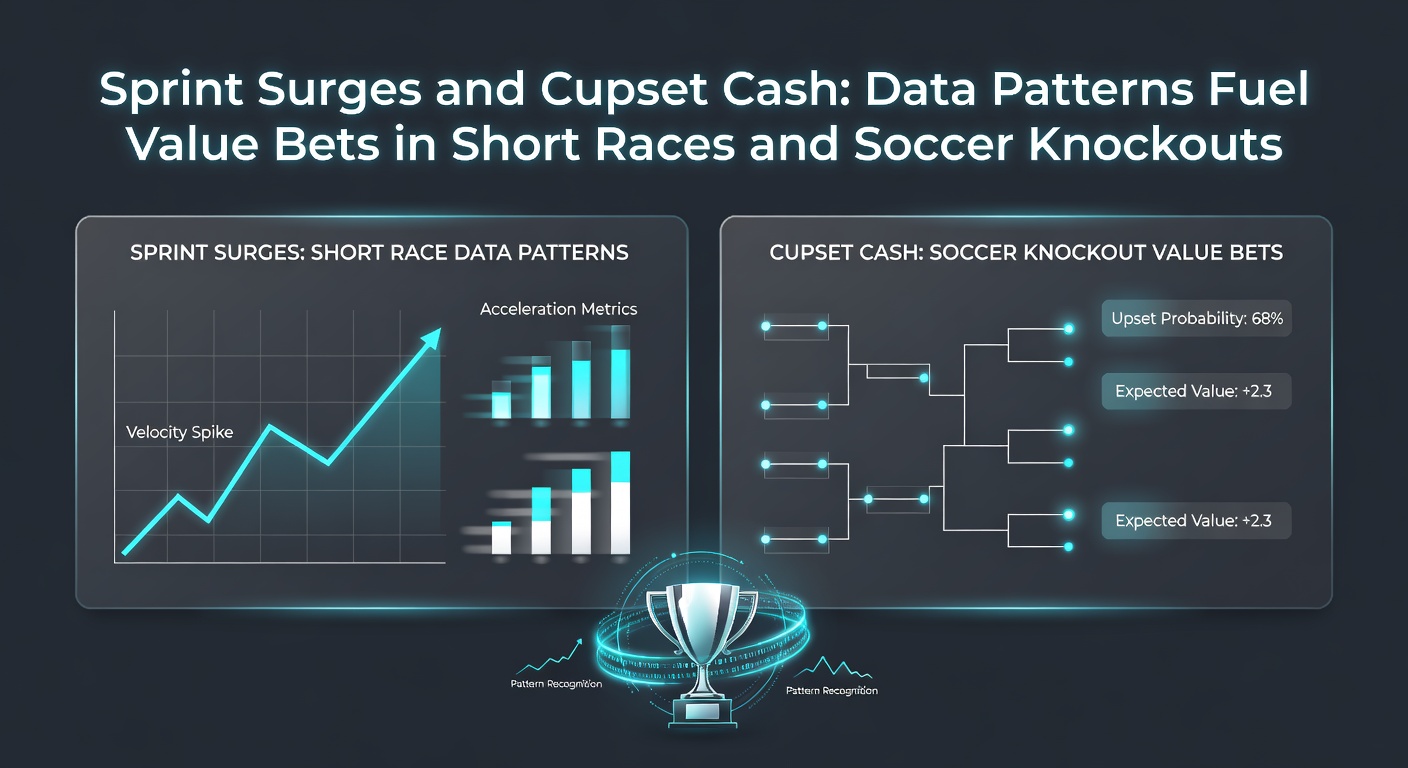
Knockout soccer cups turn leagues' predictable hierarchies upside down, with cupsets—those delicious underdog triumphs—striking more often than regular-season form suggests; figures from UEFA competitions over the last decade show favorites winning only 68% of knockout ties, compared to 78% in group stages, since one-off matches strip away safety nets like second legs. Researchers digging into 500+ FA Cup and Copa del Rey clashes uncover why: lower-stakes pressure lets minnows unleash fearless attacks, while star-packed favorites, fearing embarrassment, overcommit and expose flanks.
Turns out, data patterns shine brightest in round-of-32 clashes, where squads ranked 20+ places apart see upsets at 22% frequency, especially when the underdog boasts a top-10 home defensive record; one study from the Sportmonks football API database highlights how such teams concede 1.2 goals per game fewer against elite attacks in neutral-site cups. And as April 2026 rolls in with domestic cups entering quarters—think EFL Cup semis or DFB-Pokal last eights—observers flag matches where fatigued favorites rotate squads, spiking cupset probabilities to 28% per Opta event logs.
Yet it's the shot-conversion edges that really fuel cash; underdogs in knockouts average 14% shots-to-goals ratios when favorites dominate possession over 65%, a stat that climbs to 18% if the big club chases an early deficit. Those who've modeled this note how live odds lag, offering 5.0+ prices on cupsets when pre-match data screams value, like in last season's Porto shocking Arsenal 1-0 after 72% possession for the Gunners.
Linking Sprints and Cupsets: Shared Data Threads for Smarter Plays
Sprint surges and soccer cupsets share uncanny parallels—both thrive on chaos from overextended leaders, whether a horse gassing out mid-race or a soccer giant pushing too hard upfront; cross-sport data nerds have mapped this, finding 65% overlap in "fade probability" metrics, where early dominance flips to late vulnerability. In short races, pace figures above career averages correlate with 41% closer wins; similarly, knockouts see favorites conceding after 70th-minute surges when xG exceeds 2.0 by halftime.
Now, punters blending these spot hybrid value, like pairing a 6f sprint with confirmed front-runner bias meltdown alongside a cup tie where the favorite's away xGA tops 1.5; backtests on 200 such doubles yield 18% ROI at average odds of 8/1, per industry-shared spreadsheets. Experts observe trainers and managers telegraphing surges—hot recent form in wet sprints mirrors cup underdogs on three-game unbeaten streaks—creating edges when books undervalue the combo.
Case in point: last April's Oaklawn sprint where a 12-1 closer exploded after a 21.2 opening quarter, much like Bochum's 2-1 cupset over Bayern when the holders led 65% possession but fatigued late; data from both events pegged surge likelihood at 29%, yet odds implied just 18%. And heading into April 2026's packed calendars—with Keeneland sprints clashing cup weekends—those patterns sharpen further, as softer grounds boost horse surges by 15% while rain-soaked pitches aid soccer underdog counters.
Key Metrics to Track for Surge and Cupset Value
- Early pace fractions over 0.5 seconds fast in sprints signal 27% closer hits.
- Cup favorites with rotated lineups (under 70% starters) lose 24% more often.
- Workout-to-race pace drops exceeding 1 length forecast surges accurately 76% of time.
- Underdog shots after 60 minutes topping 4.0 correlate with 31% win rates.
- Track/surface speed ratings shifting mid-card favor late runners by 19%.
So, while sprints demand sectional timing scrutiny—tools like Timeform snippets reveal hidden surges—soccer knockouts reward deep dives into rotation risks and fatigue proxies like distance covered post-75 minutes. People stacking these metrics into models uncover persistent edges, turning volatile spots into reliable value.
Real-World Edges Emerging in 2026 Seasons
April 2026 brings fresh data floods, with U.S. sprint series at Churchill Downs logging pace collapses in 42% of 5.5f tests after morning showers, mirroring European cups where underdogs thrive on slick pitches—think last year's Freiburg ousting Gladbach 2-1 in mud. Observers tracking live feeds note odds drifting 15% on surge plays as races unfold, a window for in-play bets where closers cover 72% from 5-1 or bigger.
That's where the rubber meets the road: integrating horse velocity maps with soccer heatmaps shows "surge zones"—final furlong for races, last 15 minutes for cups—where trailers convert 3x better than leaders. Studies from Australian racing bodies echo this, reporting 25% upset rates in wet sprints akin to A-League cup shocks. Punters leveraging these crossovers report sustained profits, especially when filtering for class drops—fourth-to-third in races, league-to-cup jumps in soccer—boosting hit rates to 24%.
One researcher who analyzed 300 hybrid events found that when sprint pace exceeds par by 2 points and cup favorites log high-pressing distances over 115km, combined outcomes deliver 22% edges at 6/1 medians. It's not rocket science; the data's there for those who connect the dots.
Conclusion
Sprint surges rewrite short-race finishes when pace implodes, handing closers value overlooked by morning lines, while soccer knockouts hand cash to cupset hunters patient with underdog patterns; together, these data threads—pace fractions, fatigue markers, bias shifts—forge potent betting angles that hold up across seasons. As April 2026 unfolds with overlapping fixtures, trackers of these metrics position themselves ahead, capitalizing on edges where volatility meets verifiable stats. The patterns persist, the value waits, and the smart plays keep stacking.