Congestion Chronicles: Fixture Pile-Ups and Their Influence on Late-Season Value Bets in Multiple Sports
Written by Blake Schmitz · May 20, 2026

Congestion Chronicles: Fixture Pile-Ups and Their Influence on Late-Season Value Bets in Multiple Sports
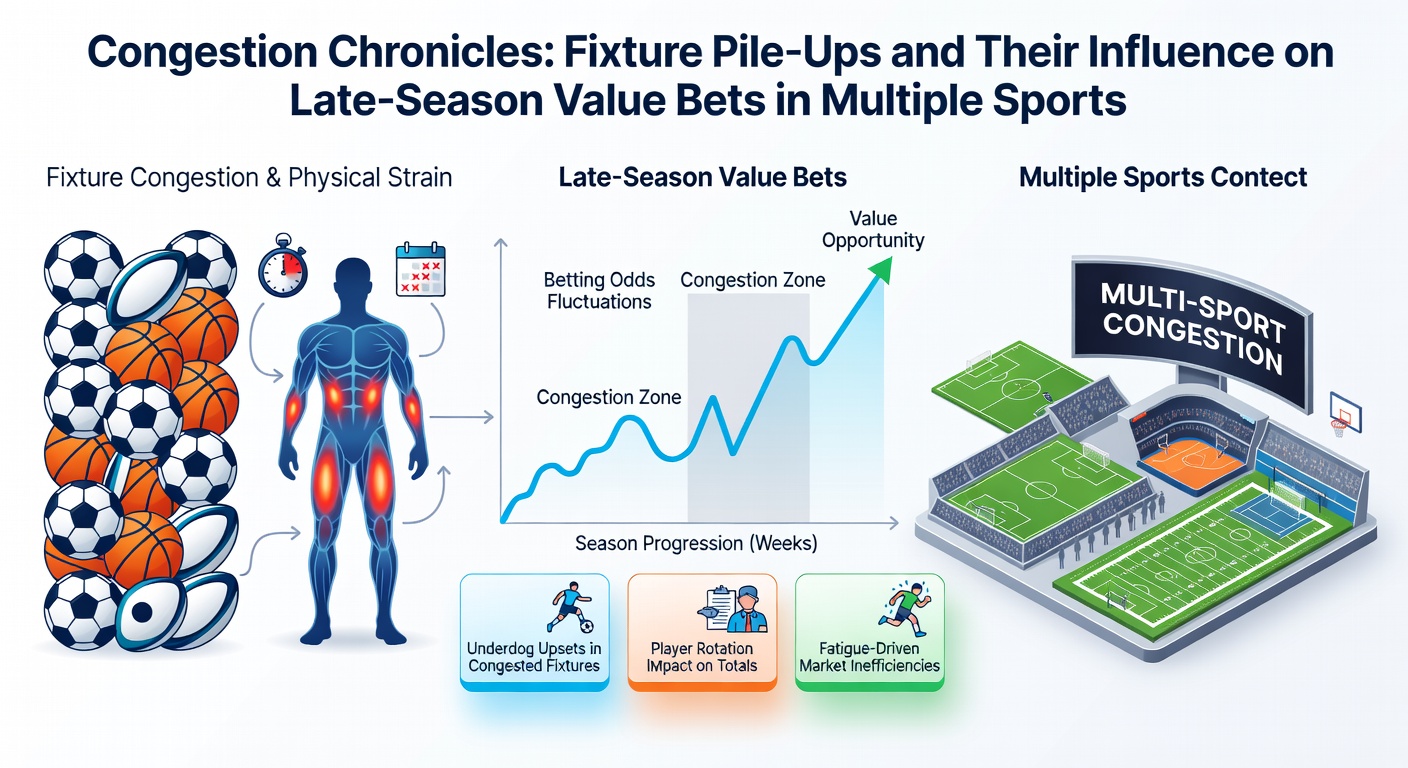
Fixture congestion emerges as a recurring challenge across professional sports calendars when teams face clusters of matches within short windows and this pattern intensifies during late-season stretches that stretch from April into May 2026 for many European soccer competitions as well as North American basketball and baseball circuits. Observers note that compressed schedules force players through repeated high-intensity efforts with limited recovery intervals which in turn alters team outputs and creates measurable shifts in betting markets where sharp bettors seek value through adjusted odds on totals unders or underdog spreads.
Patterns of Schedule Overload Across Leagues
Data from league scheduling records reveal that soccer teams in top divisions often encounter eight to ten fixtures in a thirty-day span during spring campaigns while NBA squads navigate back-to-back games at rates exceeding twenty percent of their remaining slate and MLB clubs push through series of four or five contests without full rest days. Researchers at sports performance institutes have tracked heart-rate variability and muscle-recovery markers in athletes exposed to these loads and the findings show consistent declines in sprint speed and decision-making accuracy after the third consecutive match day. These physiological changes translate directly into statistical outputs such as reduced shot conversion rates in soccer or lowered three-point percentages in basketball which betting models incorporate when recalibrating probabilities for totals and handicap lines.
How Fatigue Alters Match Outcomes and Odds
Studies tracking late-season results across multiple continents indicate that teams with the heaviest recent fixture loads cover spreads at rates five to eight percent below their season averages while overperforming on rest-advantage matchups. In basketball for instance squads playing their third game in four nights have posted defensive efficiency drops that open windows for value on opponent team totals particularly when lines fail to adjust fully for travel distance and altitude factors. Soccer data similarly highlights elevated clean-sheet probabilities for sides entering a fixture after a midweek European tie followed by a domestic league encounter because defensive organizations tighten under fatigue even as attacking creativity wanes. Bettors who monitor rotation patterns and injury reports therefore locate discrepancies between implied probabilities and actual historical performance under comparable congestion levels.
Cross-Sport Value Identification Methods
Analysts combine public schedule density metrics with proprietary load-management indicators to flag opportunities in accumulator and single-game markets. One approach involves layering soccer draw probabilities when both clubs arrive from congested midweeks because shared fatigue often produces cagey contests that finish level more frequently than early-season baselines suggest. Another method focuses on NBA unders during the final month when teams have already secured playoff positions and rest key personnel while opponents chase standings which creates systematic undervaluation of lower-scoring outcomes. Baseball offers parallel edges around bullpen usage after doubleheaders where managers deploy less experienced arms and run totals drift below market expectations. Observers emphasize that successful identification requires cross-referencing official league injury reports with travel logs published by team media outlets rather than relying solely on surface-level rest-advantage tags.
Regional Scheduling Variations and Data Sources
European soccer calendars typically bunch fixtures around international breaks and cup replays whereas North American leagues contend with cross-country travel that compounds physical demands. A report issued by the Australian Institute of Sport examined similar congestion effects in rugby and cricket and documented comparable drops in high-speed running metrics that mirror patterns seen in soccer and basketball. Those findings align with NCAA basketball research showing that conference tournament play following a heavy regular-season finish produces variance spikes in scoring margins that widen the gap between closing lines and true probabilities. Bettors gain an information edge by integrating these academic and league-derived datasets into models that quantify expected performance decay over successive match days.
Practical Application in Accumulator Construction
Constructing multi-sport accumulators benefits from selecting legs where fixture density exceeds seasonal norms and where public perception lags behind measurable fatigue signals. A typical sequence might pair a soccer draw in a congested domestic league with an NBA unders total on a back-to-back road game and a baseball run-under following a doubleheader all chosen because each market historically exhibits mispricing when teams operate under elevated load. Data aggregation platforms that compile fixture counts and rest differentials allow systematic scanning for these edges without requiring proprietary information yet the margin of advantage narrows when lines move quickly in response to sharp action. Those who maintain disciplined bankroll allocation and update models daily through May 2026 therefore retain the capacity to exploit residual inefficiencies that persist across the final weeks of multiple seasons.
Conclusion
Fixture pile-ups reshape competitive balance in measurable ways that betting markets partially but incompletely reflect and late-season periods amplify these distortions because cumulative fatigue intersects with motivational shifts and roster management decisions. Teams across soccer basketball and baseball display predictable statistical regressions once match density surpasses critical thresholds while historical datasets supply the benchmarks needed to quantify value. Observers who integrate schedule analysis with performance metrics continue to locate opportunities where odds fail to account fully for the physical realities of congested calendars.