Baseline to Backstretch: Integrating Tennis Rally Data with Horse Racing Speed Figures for Banker Bets
Written by Lars Schmitt · May 23, 2026
Baseline to Backstretch: Integrating Tennis Rally Data with Horse Racing Speed Figures for Banker Bets
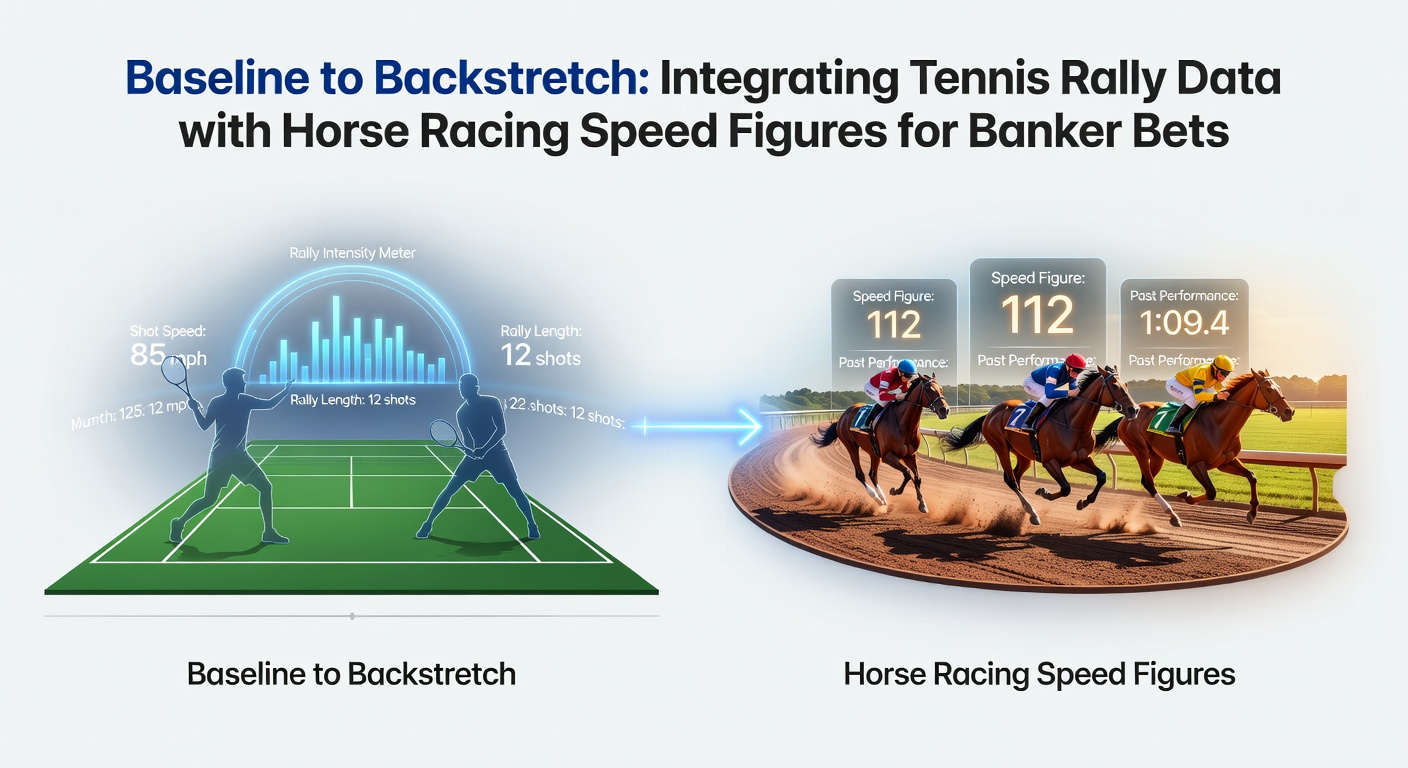
Analysts in sports data fields have developed approaches that combine tennis rally statistics with horse racing speed ratings, creating models for identifying consistent selections often labeled as banker bets in accumulator structures. These methods draw on measurable performance indicators from both sports, where tennis metrics focus on point construction patterns and horse racing figures emphasize adjusted velocity over distance.
Tennis Rally Metrics and Collection Methods
Tennis rally data tracks the number of shots exchanged during points, average rally length per set, and shifts in these patterns across different court surfaces, while researchers compile figures from professional matches using video analysis and ball tracking systems. Data indicates that longer rallies on clay courts correlate with higher endurance demands, whereas grass surfaces produce shorter exchanges that favor aggressive serving strategies. Observers note how second-set turnarounds frequently appear in match logs when players adjust their rally tolerance after dropping an opening set.
Figures from major tournaments reveal that break point conversion rates rise when average rally lengths exceed eight shots, providing a quantitative layer for performance forecasting. Those who compile these datasets often cross-reference them with player fitness reports and historical surface-specific outcomes to refine predictive inputs.
Horse Racing Speed Figures and Track Adjustments
Horse racing speed figures, such as those produced by organizations like Equibase, assign numerical ratings to performances after accounting for track conditions, distance, and pace scenarios, and these ratings help standardize comparisons across different meetings. Speed ratings adjust raw times using algorithms that incorporate wind, rail positions, and surface variants, which allows analysts to isolate true ability levels from environmental variables.
Backstretch sections of races contribute critical data points because they capture sustained effort before the final drive, while researchers have observed that horses maintaining consistent sectional times in this phase tend to deliver repeatable results in subsequent starts. Australian racing authorities publish similar adjusted metrics through their official channels, expanding the geographic scope of available datasets for multi-jurisdiction analysis.
Integration Techniques for Cross-Sport Models
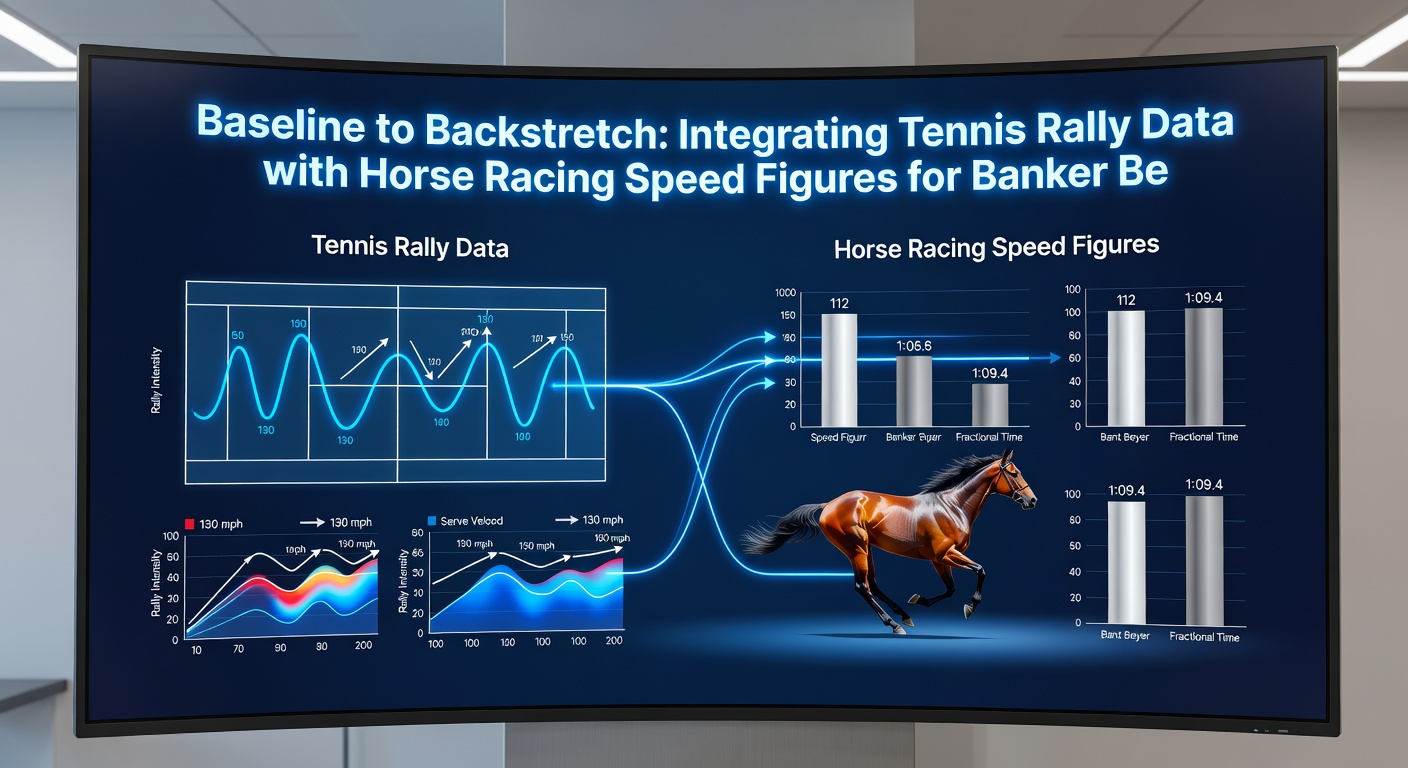
Combining tennis rally data with equine speed figures requires alignment of temporal windows and performance scales, where analysts map rally length distributions to speed rating thresholds using statistical normalization. This process involves creating composite indices that flag instances when both a tennis player's rally stability and a horse's adjusted velocity exceed defined benchmarks simultaneously. Studies from academic institutions, including those referenced in reports by the Jockey Club, demonstrate how such layered metrics can isolate selections with elevated consistency rates across separate events.
What's interesting is that software platforms now ingest live feeds from both sports to update these indices in real time, allowing adjustments as matches progress or as race fields assemble. Data shows correlations strengthen when rally endurance metrics from tennis align with late-race sectional strength in horse events scheduled within the same betting window.
Applications in Accumulator Structures During May 2026
In May 2026, several high-profile tennis tournaments overlap with major horse racing festivals, creating opportunities to test integrated models across concurrent schedules. Observers have recorded instances where selections backed by strong rally length averages and superior speed figures delivered joint success rates above baseline expectations in multi-leg bets. Industry organizations track these outcomes through aggregated reporting that covers both ATP events and thoroughbred meetings in North America and Europe.
Those constructing accumulators apply threshold filters so that only entries meeting dual criteria enter the banker category, and this filtering reduces variance when multiple legs are combined. Research indicates that surface transitions in tennis often mirror pace adjustments in racing, allowing analysts to weight variables according to historical crossover patterns documented in performance databases.
Data Sources and Validation Processes
Validation relies on historical datasets that span multiple seasons, with tennis rally logs drawn from official match statistics and horse speed figures sourced from timing systems certified by regulatory bodies. The International Tennis Federation maintains public archives that researchers cross-check against racing authority publications to confirm alignment accuracy. Analysts periodically recalibrate models when new court installations or track renovations alter baseline conditions.
Turnout shows that models incorporating both rally volatility measures and speed figure deviations produce narrower prediction intervals than single-sport approaches alone. This narrowing occurs because independent variables from each sport offset noise present in the other dataset.
Conclusion
Integration of tennis rally data with horse racing speed figures supplies a structured framework for evaluating banker bet candidates within accumulator formats. The approach rests on quantifiable metrics that analysts refine through ongoing validation against live and archived results. As data collection systems advance, the precision of these cross-sport linkages continues to develop without reliance on subjective judgment.